Updates

About us

Navigator
How Reforestum leverages satellite images and machine learning models to monitor conservation forestry projects
 Javier Sáez Gallego · Corporate Climate Solutions · Sep 2022
Recap of conservation and restoration forestry projects
Before getting into the subject it is worth recalling what a conservation project is and how it works to better understand why remote monitoring is so important.
- According to the International Union for Conservation of Nature, Nature-Based Solutions (NBSs) are “actions to protect, sustainably manage and restore natural and modified ecosystems in ways that address societal challenges effectively and adaptively, to provide both human well-being and biodiversity benefits”.
- One of the NBSs are conservation and restoration forestry projects (hereinafter conservation projects), which are large-scale and long-term projects that aim to protect forests and biodiversity by preventing them from being illegally plundered, typically from illegal logging or burning. They usually are offset projects and, as explained in the article what is a carbon offset, avoidance is the way in which the carbon compensation takes place.
- The carbon credits for conservation projects are issued by comparing the actual state of the protected forest with a non-intervention baseline scenario, which refers to the predicted situation of the forest at a given time if the protection of the ecosystem would not occur.
- Auditing and monitoring through strict and reliable standards enable the issuance of high-quality carbon credits. In this context, Verra is a nonprofit organisation that develops methodological standards that attempt to ensure the veracity and quality of the carbon avoidance of projects. In other words: Verra defines what is the “right way” to manage and track a project that wants to sell carbon credits.
- For that, a third party audits the conservation project on a regular basis, assessing whether the societal and environmental requirements are being satisfied according to the methodology used. The company does a visit to the site, interviews key stakeholders, and performs remote monitoring analysis to calculate the total loss of forest area.
- If the project is being implemented successfully, then carbon credits are issued amounting to the difference between the actual carbon stocks and the baseline scenario (known as Verified Carbon Units under the Verra methodologies).
The need for frequent and accessible monitoring
Given the importance of audits in conservation projects, it is worth asking whether we need accessible and frequent monitoring in this type of projects. The answer is yes. Why is that?
- Regarding the accessibility of information, the official verification and monitoring efforts are summarized in public verification reports, which tend to be long, technical, and tedious. Most people do not fancy reading a 50-page dense biyearly report but would prefer to know that the forests they support are alive and healthy. We like seeing with our own eyes as well as understanding the results of conservation efforts.
- The frequency of the monitoring events is also a concern to the players in the voluntary carbon markets, as they take place only before issuing new credits (typically every two years). If a user wants to support the conservation project but the last monitoring report was done, for example, more than a year ago, there is a risk that the user will end up not completing the offset due to a lack of trust. Reducing the time between monitoring events is one of the main pillars to solve.
The good news is that we are able to offer a better user experience by providing curated information in an easy, transparent and trustworthy way and to monitor the forests more frequently by leveraging the vast fleet of satellites and big data technologies.
At Reforestum, we provide a user-friendly monitoring experience which is rigorous and precise, while concise to reach the majority of the public. Our approach complements Verra’s methodology with more frequent and transparent monitoring tools. We believe this will directly translate into increasing trust in conservation projects, leading to collaborative protection and restoration of the Earth’s forest ecosystems.
How to monitor huge and hard-to-access forests
The European Space Agency (ESA) launched in 2016 two satellites of the Sentinel2 mission, providing 10-meter multispectral imagery that can be accessed for free, taking pictures from above roughly 2 times per week.
By using those images we can visually monitor the state of the forest and check if some parts of it have been logged out. If we want to be thorough (and we must be, since our goal is to ensure quality conservation projects), each pixel of the image taken by the satellite needs to be reviewed and assessed whether the forest is still standing.
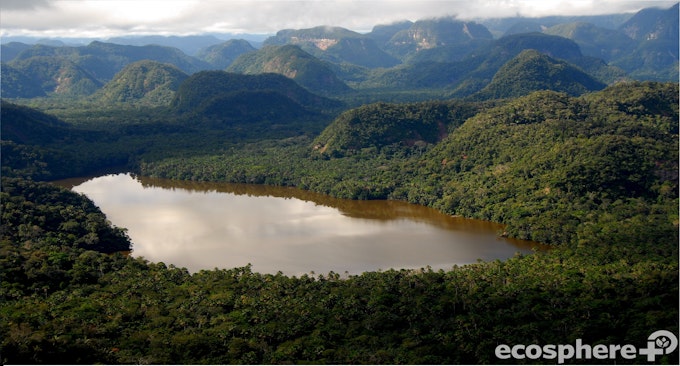
Let us do a brief recap: each "image" of the Cordillera Azul project contains roughly 60 million pixels. If we were to manually review each pixel, at an average of 1 second each pixel, every image would take us 2 years to inspect! We would need a team of 833 people looking at pixels for 8 hours per day to monitor images biweekly for a single project like Cordillera Azul.
As this is clearly neither efficient nor scalable, we can address the challenge by taking advantage of technological advances in the fields of statistics: Machine Learning (ML) and Artificial Intelligence (AI). In particular, we use advanced techniques from the field of computer vision to create predictive models that can interpret the pixels of the images and apply them without human intervention to newly acquired images.
How Reforestum estimates carbon stocks using machine learning
The process Reforestum implements to turn the many-mega-pixel satellite images into carbon stocks contents is the following:
- Identify the land types (classification). Typically, eight types of land can be distinguished: trees, shrubs and scrub, grassland, bare ground, cultivated areas, human structures, water and others.
- Train a ML model. This is the process of teaching a computer to classify what the land type of each pixel is, so that the machine can infer what is below each pixel automatically, rather than doing it manually. To train a model we first provide it with a training dataset or annotated dataset. it is enough to use a dozen km2 to infer what is in the rest of the area. Think of the ML model as a box with a bunch of mathematical equations with unknown parameters, and the training process as teaching: we iteratively provide the model of the input image and the output (annotated) solution until the unknown parameters are "learned". After the training process, the model can turn an input image into a predicted solution by itself.
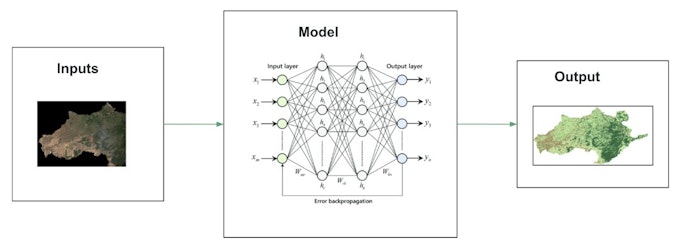
- Turn land cover into carbon stock. Each type of land has a CO2 equivalent per area, thanks to the in-situ samples taken by the project developer during the auditing processes. This information is publicly available, see, for example, Table 3.17 from the Cordillera Azul project description. By cross-referencing the number of pixels for each type of land with the corresponding CO2 equivalent per pixel we obtain the average total CO2 stocks in the forest at a given time. At this stage, with the help of computers and applied mathematical models, we can transform an image of 60 million pixels into CO2 quantities in a matter of minutes without the need for human supervision.
- Automatize and deploy the model to the cloud. We automatically run the model every time new satellite images are available, processing them and making them accessible to our users through Reforestum’s forest explorer. Reforestum is a member of the Microsoft AI for Earth community, and thanks to the support of Microsoft for Startups, our technical operations are supported in the Azure cloud.
Technology at the service of trust and transparency through the Reforestum platform
Reforestum provides access to weekly monitoring of conservation projects via our forest explorer in the marketplace. Our goal is to make offsets user-friendly and intuitive for everyone, while being rigorous about how projects are monitored. We do not aim to replace current verification mechanisms but rather enhance them and make them more tangible.
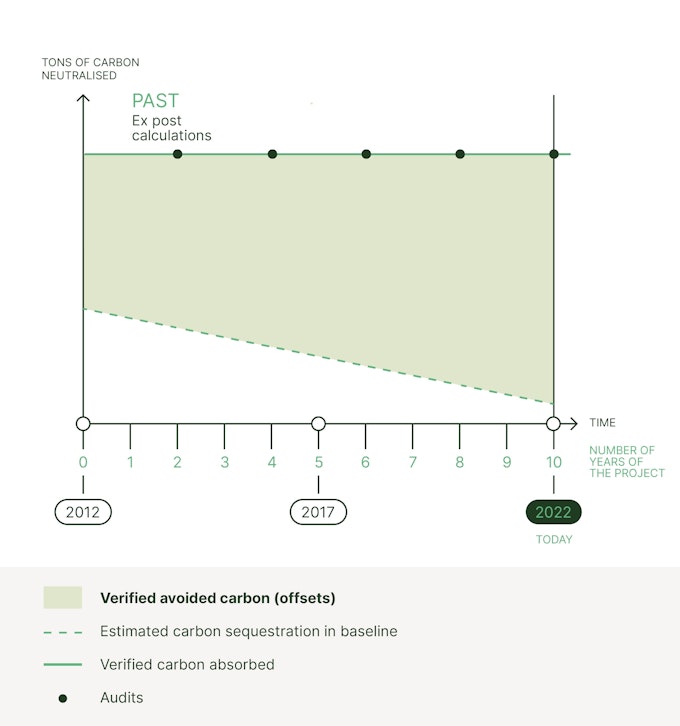
Check out the CO2 calculations for Cordillera Azul:
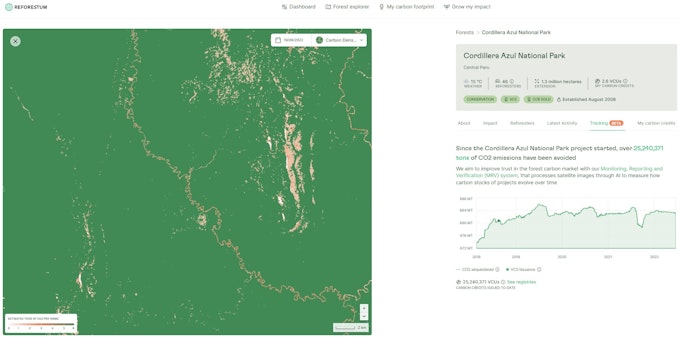
On the right, the graph shows the total CO2 equivalent carbon stocks of the forest inside the project (vertical axis)at a given time (horizontal axis). We believe this metric is generic enough to be applied to other projects, and easily understandable by the general public that accesses Reforestum’s marketplace.
The graph can help assess the carbon stock changes of the project at a glance. In the hypothetical case the forest was severely cut, we would see a decreasing curve, hence we should worry! Currently, the trend of the curve is quite flat considering the scale, meaning that deforestation is not widespread and we can expect the project to be properly protected. The machine learning model suffers slightly from noise due to cloud cover and other atmospheric changes, explaining partly the “ups and downs” of the curve.
The roadmap to ultimate transparency: the role of Google’s Dynamic World app
Reforestum started by developing in-house machine learning models with closed-source code. This approach has proved to be applicable for large-scale monitoring, however, it lacks reproducibility, a very common issue in science. We believe the avenue to trustful and transparent forest monitoring is via open-sourcing the code and letting anyone run the analysis to double-check our claims about carbon stocks. We are soon integrating our platform with the open-source Google’s Dynamic world app to live up to our transparency values. Moreover, we have released our internal code on GitHub to allow anyone to run the same analysis.
Our monitoring tools are constantly evolving, meaning that this is only the beginning of a long road of product improvements. Our first step was to deploy our monitoring solution to the Cordillera Azul project and in the upcoming months we will focus on:
- Fully integrate Reforestum’s platform with Google’s Dynamic world app
- Monitor more projects
- Replicate Verra’s methodology as closely as possible, while keeping concepts simple to broadcast our message to the main public.
- Incrementally improve the open-source repository, for anyone to run their own forest monitoring
Keep an eye on our social media to be updated! Would you like to know more about our monitoring tools? Are you an organization interested in monitoring your projects, or contributing to improving them?
Contact us and say hello!
Grow Your Knowledge